Dragonfly Doji Pattern


Candlestick charts have been an essential tool for technical analysts for many years. They are used to represent the price movements of a security or financial instrument over a specific period. These charts offer traders and investors valuable insights into the market’s sentiment, and the patterns like dragonfly doji can provide guidance for potential trading opportunities.

Being one of the most commonly used candlestick patterns, it occurs when the opening, closing, and high prices of a financial instrument are almost identical, creating a long lower shadow and an absence of an upper shadow. This pattern can indicate a potential trend reversal, making it essential for traders and investors to understand its significance.

The dragonfly doji pattern can be seen in any timeframe, making it useful for both short-term and long-term traders. It can appear in different markets, including stocks, futures, and currencies, and is used in both technical and fundamental analysis.

In this article, we will provide an in-depth analysis of the dragonfly doji pattern. We will cover its characteristics, significance, and how it can be used to develop trading strategies. By understanding this pattern, traders and investors can better interpret market sentiment, identify potential trend reversals, and develop a more effective trading strategy.

Characteristics and description

The dragonfly doji is a unique candlestick pattern that has specific characteristics that set it apart from other candlestick patterns. In this section, we will discuss the characteristics of a dragonfly doji and how it can be identified.

A doji candlestick is a pattern where the opening and closing prices of a security are nearly identical. This creates a small or nonexistent body, and the candlestick appears as a cross or plus sign. The doji candlestick pattern suggests that the market is in a state of indecision or balance between buyers and sellers.

Dragonfly Doji Candlestick Pattern - What Is And How To Trade - Living From Trading

The dragonfly doji is a specific type of doji candlestick pattern that occurs when the opening and closing prices are almost identical and at the high of the trading session. It creates a long lower shadow, indicating that buyers have been in control during the session, pushing the price down. However, as the session ends, buyers have regained control, pushing the price back up to close near the opening price.

In contrast to other doji patterns, the dragonfly doji has a long lower shadow and an absence of an upper shadow. This pattern’s unique characteristics suggest that buyers have gained control and that the market may be ready for a potential uptrend.

Overall, understanding the unique characteristics of a dragonfly doji can help traders and investors identify potential market trends and make informed trading decisions.

Significance of a Dragonfly Doji

The dragonfly doji is a powerful candlestick pattern that can provide valuable insights into the market’s sentiment. In this section, we will discuss the significance of a dragonfly doji and how it can be interpreted in both bullish and bearish markets.

In a bullish market, the appearance of a dragonfly doji can indicate a potential trend reversal. It suggests that buyers have regained control, pushing the price up, and that the market may be ready for an uptrend. However, it is essential to consider other factors, such as volume and other indicators, to confirm this potential reversal.

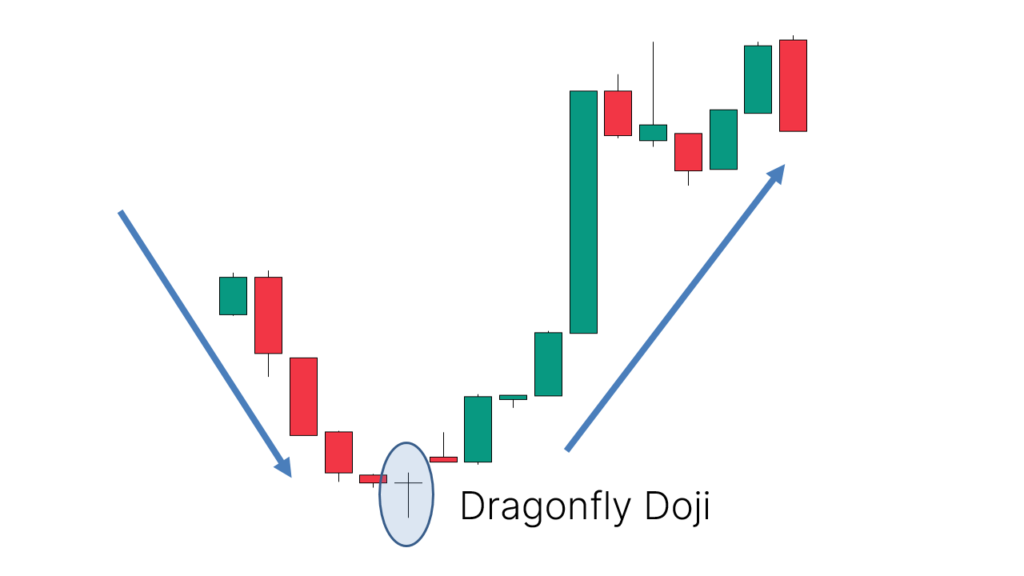
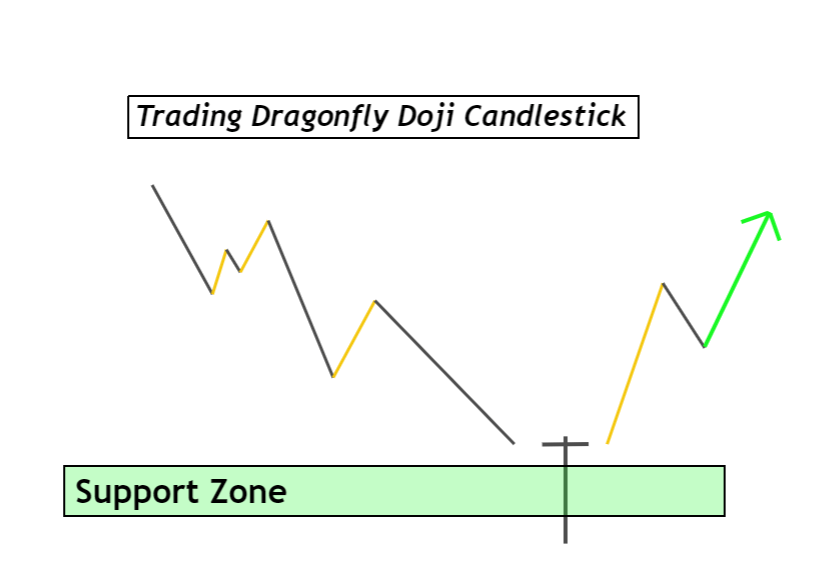
In a bearish market, the appearance of a dragonfly doji can indicate a possible bottom. It suggests that sellers have been in control, pushing the price down, but buyers have regained control, pushing the price back up to close near the opening price. This pattern can indicate that the market may be ready for a potential uptrend. However, as with a bullish market, it is essential to consider other factors to confirm this potential reversal.

The psychology behind the dragonfly doji pattern is essential to understand. The long lower shadow suggests that buyers have been in control during the trading session, but the sellers have managed to push the price down. However, as the session ends, buyers regain control, pushing the price back up to close near the opening price. This tug of war between buyers and sellers creates a state of balance and indecision, potentially leading to a trend reversal.

Overall, the significance of a dragonfly doji is that it can provide valuable insights into the market’s sentiment and potential trend reversals. However, as with all candlestick patterns, it is essential to consider other factors and technical indicators to confirm potential reversals and make informed trading decisions.

Trading Strategies Using Dragonfly Doji

The dragonfly doji can be a powerful tool for traders and investors to develop trading strategies. In this section, we will discuss some common trading strategies that use thepattern.

One way to use the dragonfly doji pattern is as a buy signal. When the pattern appears, it suggests that buyers have regained control and that the market may be ready for an uptrend. Traders and investors can use this as a signal to enter a long position or to add to an existing long position.

Conversely, the dragonfly doji can also be used as a sell signal. In a bearish market, the appearance of a pattern can suggest that the market may be ready for a potential uptrend. Traders and investors can use this as a signal to exit a short position or to enter a long position.

Finally, traders and investors can combine the dragonfly doji pattern with other technical indicators to develop more robust trading strategies. For example, traders may use volume indicators to confirm potential trend reversals or moving averages to identify trends and potential support and resistance levels.

Combining Dragonfly Doji with Indicators

Combining the Dragonfly Doji candlestick pattern with the Supply and Demand indicator can help traders make more informed trading decisions. The Dragonfly Doji pattern can identify potential trend reversals, while the Supply and Demand indicator can confirm market sentiment and help traders identify key support and resistance levels. By combining these two tools, traders can potentially improve their trading performance and achieve their financial goals.

Dragonfly Doji Trading Guide with 2 Confluences - ForexBee

Combining the Dragonfly Doji candlestick pattern with the Supertrend indicator can enhance traders’ ability to identify potential trend reversals and improve their trading performance. The Dragonfly Doji pattern can signal a shift in market sentiment, while the Supertrend indicator can confirm the trend and provide key levels of support and resistance.

Traders can use the Dragonfly Doji pattern to identify potential trend reversals when it appears after a significant downtrend or uptrend. The pattern can indicate that buyers or sellers are gaining strength and signal a potential reversal in the trend.

Limitations of the pattern

While the dragonfly doji is a valuable tool for traders and investors, there are instances where the pattern may not be reliable. In this section, we will discuss some limitations of thepattern.

First, the pattern may not be reliable in a market with low liquidity. In such cases, a single trader or group of traders may be able to manipulate the price, leading to false signals.

Second, the pattern may not be reliable if it appears too frequently. If the pattern appears too often, it may suggest that the market is in a state of indecision or balance, making it difficult to identify potential trend reversals.

Third, the pattern may not be reliable if other technical indicators contradict the signal. For example, if volume indicators suggest that the market is in a downtrend, but a dragonfly doji pattern appears, it may be a false signal.

It is essential to consider other factors before making a trading decision based on the pattern. Traders and investors should consider volume indicators, moving averages, and other technical indicators to confirm potential trend reversals and make informed trading decisions.

Conclusion

The dragonfly doji candlestick pattern is a type of doji pattern that appears in financial charts. It is characterized by a long lower shadow and an absence of an upper shadow, with the open, close, and high prices all being very close to each other.

The pattern is essential in technical analysis as it helps traders and investors identify potential trend reversals. It is especially useful in identifying bullish trends when it appears in a downtrend or bearish trends when it appears in an uptrend.

Traders and investors can use the pattern as a signal to enter or exit positions. Additionally, they can combine the pattern with other technical indicators to develop more robust trading strategies. However, it is crucial to consider other factors and technical indicators before making a trading decision based solely on the pattern.

In conclusion, the dragonfly doji pattern is a valuable tool in technical analysis that can help traders and investors make informed trading decisions. By incorporating the pattern into their trading strategies, traders can potentially improve their trading performance and achieve their financial goals.