Chart patterns are visual representations of price movements in financial markets that traders use to identify potential trends and make informed trading decisions. These patterns can be found on various charts, such as line charts, bar charts, and candlestick charts. Chart patterns that will be shown in the chart patterns cheat sheet below, are important in trading because they provide valuable insights into the market’s psychology and can help traders anticipate future price movements. By recognizing chart patterns, traders can make better trading decisions by identifying potential entry and exit points, setting stop-loss orders, and managing their risk. Additionally, chart patterns can help traders determine the strength of a trend, as well as potential reversal points. In short, chart patterns are an essential tool for technical analysts and traders looking to make profitable trades. The purpose of this article is to provide a cheat sheet of commonly used chart patterns, including basic and advanced patterns, along with tips for using them effectively. With this cheat sheet, traders can easily identify and understand chart patterns, giving them a valuable edge in the financial markets. Below there are described all these patterns in details and live chart examples so you can easily identify it. Example: The chart below shows an example of a head and shoulders pattern and following trend reversal. Significance: The head and shoulders pattern is significant because it suggests that a trend reversal may occur. Traders can use this pattern to anticipate a bearish trend and take short positions. Example: The chart below shows an example of a double top pattern and reversal of the trend. Significance: Double top and double bottom patterns are significant because they suggest a trend reversal may occur. Traders can use these patterns to anticipate bullish or bearish trends and take long or short positions. Example: The chart below shows examples of a triple bottom and tripple top patterns . Significance: Triple top and triple bottom patterns are significant because they suggest a trend reversal may occur. Traders can use these patterns to anticipate bullish or bearish trends and take long or short positions. Example: The chart below shows an example of a symmetrical triangle pattern in the Gold asset. Significance: The symmetrical triangle pattern is significant because it suggests that the current trend may continue. Traders can use this pattern to anticipate a bullish or bearish continuation and take long or short positions. Example: The chart below shows examples of an ascending and descending triangle patterns in comparison to symmetrical triangle. Significance: Ascending and descending triangle patterns are significant because they suggest that the current trend may continue. Traders can use these patterns to anticipate bullish or bearish continuations and take long or short positions. Example: The chart below shows an example of a rectangle pattern in the USD/JPY pair. Significance: The rectangle pattern is significant because it suggests that the current trend may continue. Traders can use this pattern to anticipate a bullish or bearish continuation and take long or short positions. Overall, these basic chart patterns are essential to understand for any trader. They provide valuable information on market trends, reversals, and continuations, allowing traders to make informed decisions and take profitable positions. By recognizing these patterns, traders can gain an edge in the market and increase their chances of success. In addition to the basic chart patterns, there are also more advanced chart patterns that traders can use to make informed trading decisions. In this section, we will define and explain some of the most commonly used advanced chart patterns. Here’s the advanced chart patterns sheet with structure examples. Below are the detailed examples of the described advanced chart patterns: The cup and handle pattern is a bullish continuation pattern that typically occurs in uptrends. It consists of a cup-shaped curve followed by a smaller handle. The curve of the cup is formed by a price decline followed by a price recovery to the previous high. The handle is a small dip in prices that occurs after the cup is formed, followed by a breakout above the previous high. Example: The chart below shows an example of a cup and handle pattern in the AUD/USD pair. Significance: The cup and handle pattern is significant because it suggests that the uptrend will continue. Traders can use this pattern to take long positions and set stop-loss orders below the handle’s low. The flag and pennant patterns are both short-term continuation patterns that typically occur after a significant price move. The flag pattern consists of a sharp price move followed by a rectangular pattern, while the pennant pattern consists of a sharp price move followed by a symmetrical triangle pattern. Example: The chart below shows the difference between pennant and flag patterns. Significance: The flag and pennant patterns are significant because they suggest that the previous price trend will continue. Traders can use these patterns to take long or short positions, depending on the direction of the trend. The wedge pattern is a reversal pattern that consists of two converging trend lines that slope in the same direction. There are two types of wedge patterns: rising wedges and falling wedges. A rising wedge occurs when the price makes higher highs and higher lows, while the trend line connecting the lows is steeper than the trend line connecting the highs. A falling wedge occurs when the price makes lower lows and lower highs, while the trend line connecting the highs is steeper than the trend line connecting the lows. Example: The chart below shows an example of a falling wedge pattern in the EUR/JPY pair. Significance: The wedge pattern is significant because it suggests that the current trend is likely to reverse. Traders can use this pattern to take long or short positions, depending on the direction of the breakout. The Gartley pattern is a complex reversal pattern that consists of several price swings that form a distinct shape. The pattern is named after H.M. Gartley, who first described it in his book, “Profits in the Stock Market.” The Gartley pattern consists of a bullish or bearish move, followed by a retracement to a specific level, and then a move in the opposite direction. Example: The chart below shows an example of a Gartley pattern. Significance: The Gartley pattern is significant because it suggests that the current trend is likely to reverse. Traders can use this pattern to take long or short positions, depending on the direction of the breakout. Overall, advanced chart patterns provide traders with additional tools to identify potential market trends and make informed trading decisions. By understanding these patterns, traders can gain an edge in the market and improve their trading strategies. However, it’s important to note that chart patterns are not foolproof and should be used in conjunction with other technical indicators and fundamental analysis to confirm trading decisions. Additionally, traders should always have a risk management plan in place to minimize losses in case the market doesn’t behave as expected. Using chart patterns can be a valuable tool in trading, but it’s important to use them effectively to improve your chances of success. Here are some tips for using chart patterns effectively: Real-world examples of these tips can be seen in the following scenarios: Chart patterns can be powerful tools on their own, but they can become even more effective when combined with other technical indicators. Two indicators that can complement chart patterns are the supply and demand indicator and the SuperTrend indicator. The Supply and Demand indicator is a popular tool for identifying areas of support and resistance. By using this indicator in conjunction with chart patterns, traders can gain a better understanding of the levels at which supply and demand are likely to intersect. This can help traders to make more informed decisions about when to enter and exit trades. The SuperTrend indicator is another useful tool for traders who are using chart patterns. This indicator can help to confirm the trend direction, which can be particularly helpful when analyzing chart patterns that are less clear-cut. By combining the SuperTrend indicator with chart patterns, traders can improve their chances of identifying profitable trading opportunities. In addition to these indicators, traders can also use Currency Strength Indicators to complement chart patterns. These indicators provide an overview of the relative strength of different currencies, which can be particularly useful for traders who are analyzing currency pairs. By using currency strength indicators in conjunction with chart patterns, traders can gain a better understanding of how different currencies are likely to behave in the market. Overall, by using chart patterns with indicators like supply and demand, SuperTrend, and currency strength indicators, traders can improve their ability to analyze market data and make informed trading decisions. However, it’s important to remember that no indicator or tool is foolproof, and traders should always exercise caution and have a solid risk management plan in place. In conclusion, chart patterns are important tools that traders can use to analyze market data and make informed trading decisions. By understanding the different types of chart patterns and how they can be used to predict market trends, traders can improve their chances of success in the market. In this article, we’ve provided a cheat sheet of commonly used chart patterns, including basic patterns such as head and shoulders and symmetrical triangle, as well as advanced patterns such as cup and handle and Gartley pattern. We’ve also offered tips for using chart patterns effectively, including using multiple timeframes, combining with other technical indicators, watching for volume changes and price breakouts, and being patient and waiting for confirmation before making trading decisions. We encourage readers to use this cheat sheet as a reference when analyzing market data and making trading decisions. Remember that chart patterns are not foolproof and should be used in conjunction with other technical indicators and fundamental analysis to confirm trading decisions. Additionally, traders should always have a risk management plan in place to minimize losses in case the market doesn’t behave as expected.

Basic Chart Patterns


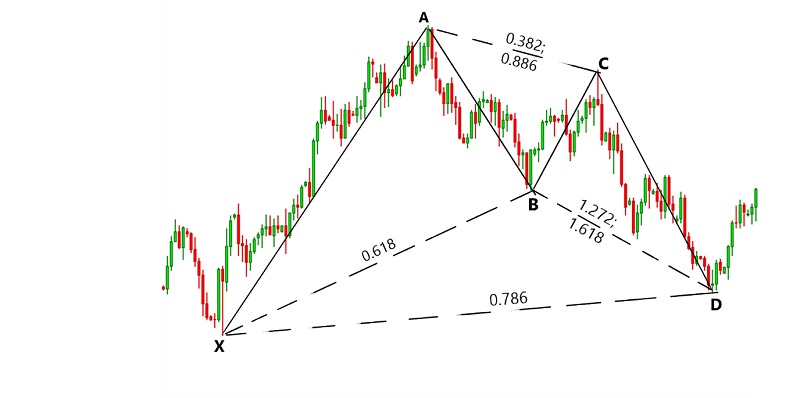
Advanced Chart Patterns


.png)
Tips for Using Chart Pattern Cheat Sheet
Using Chart Patterns Cheat Sheet with Indicators
Conclusion